Strike first.
Eight indicators that show the trend, the momentum and the pressure behind it, then tell you what it all means in plain English.
- Works on TradingView
- Signals confirm on bar close
- Plans from $29
All eight indicators working as one read of the chart.
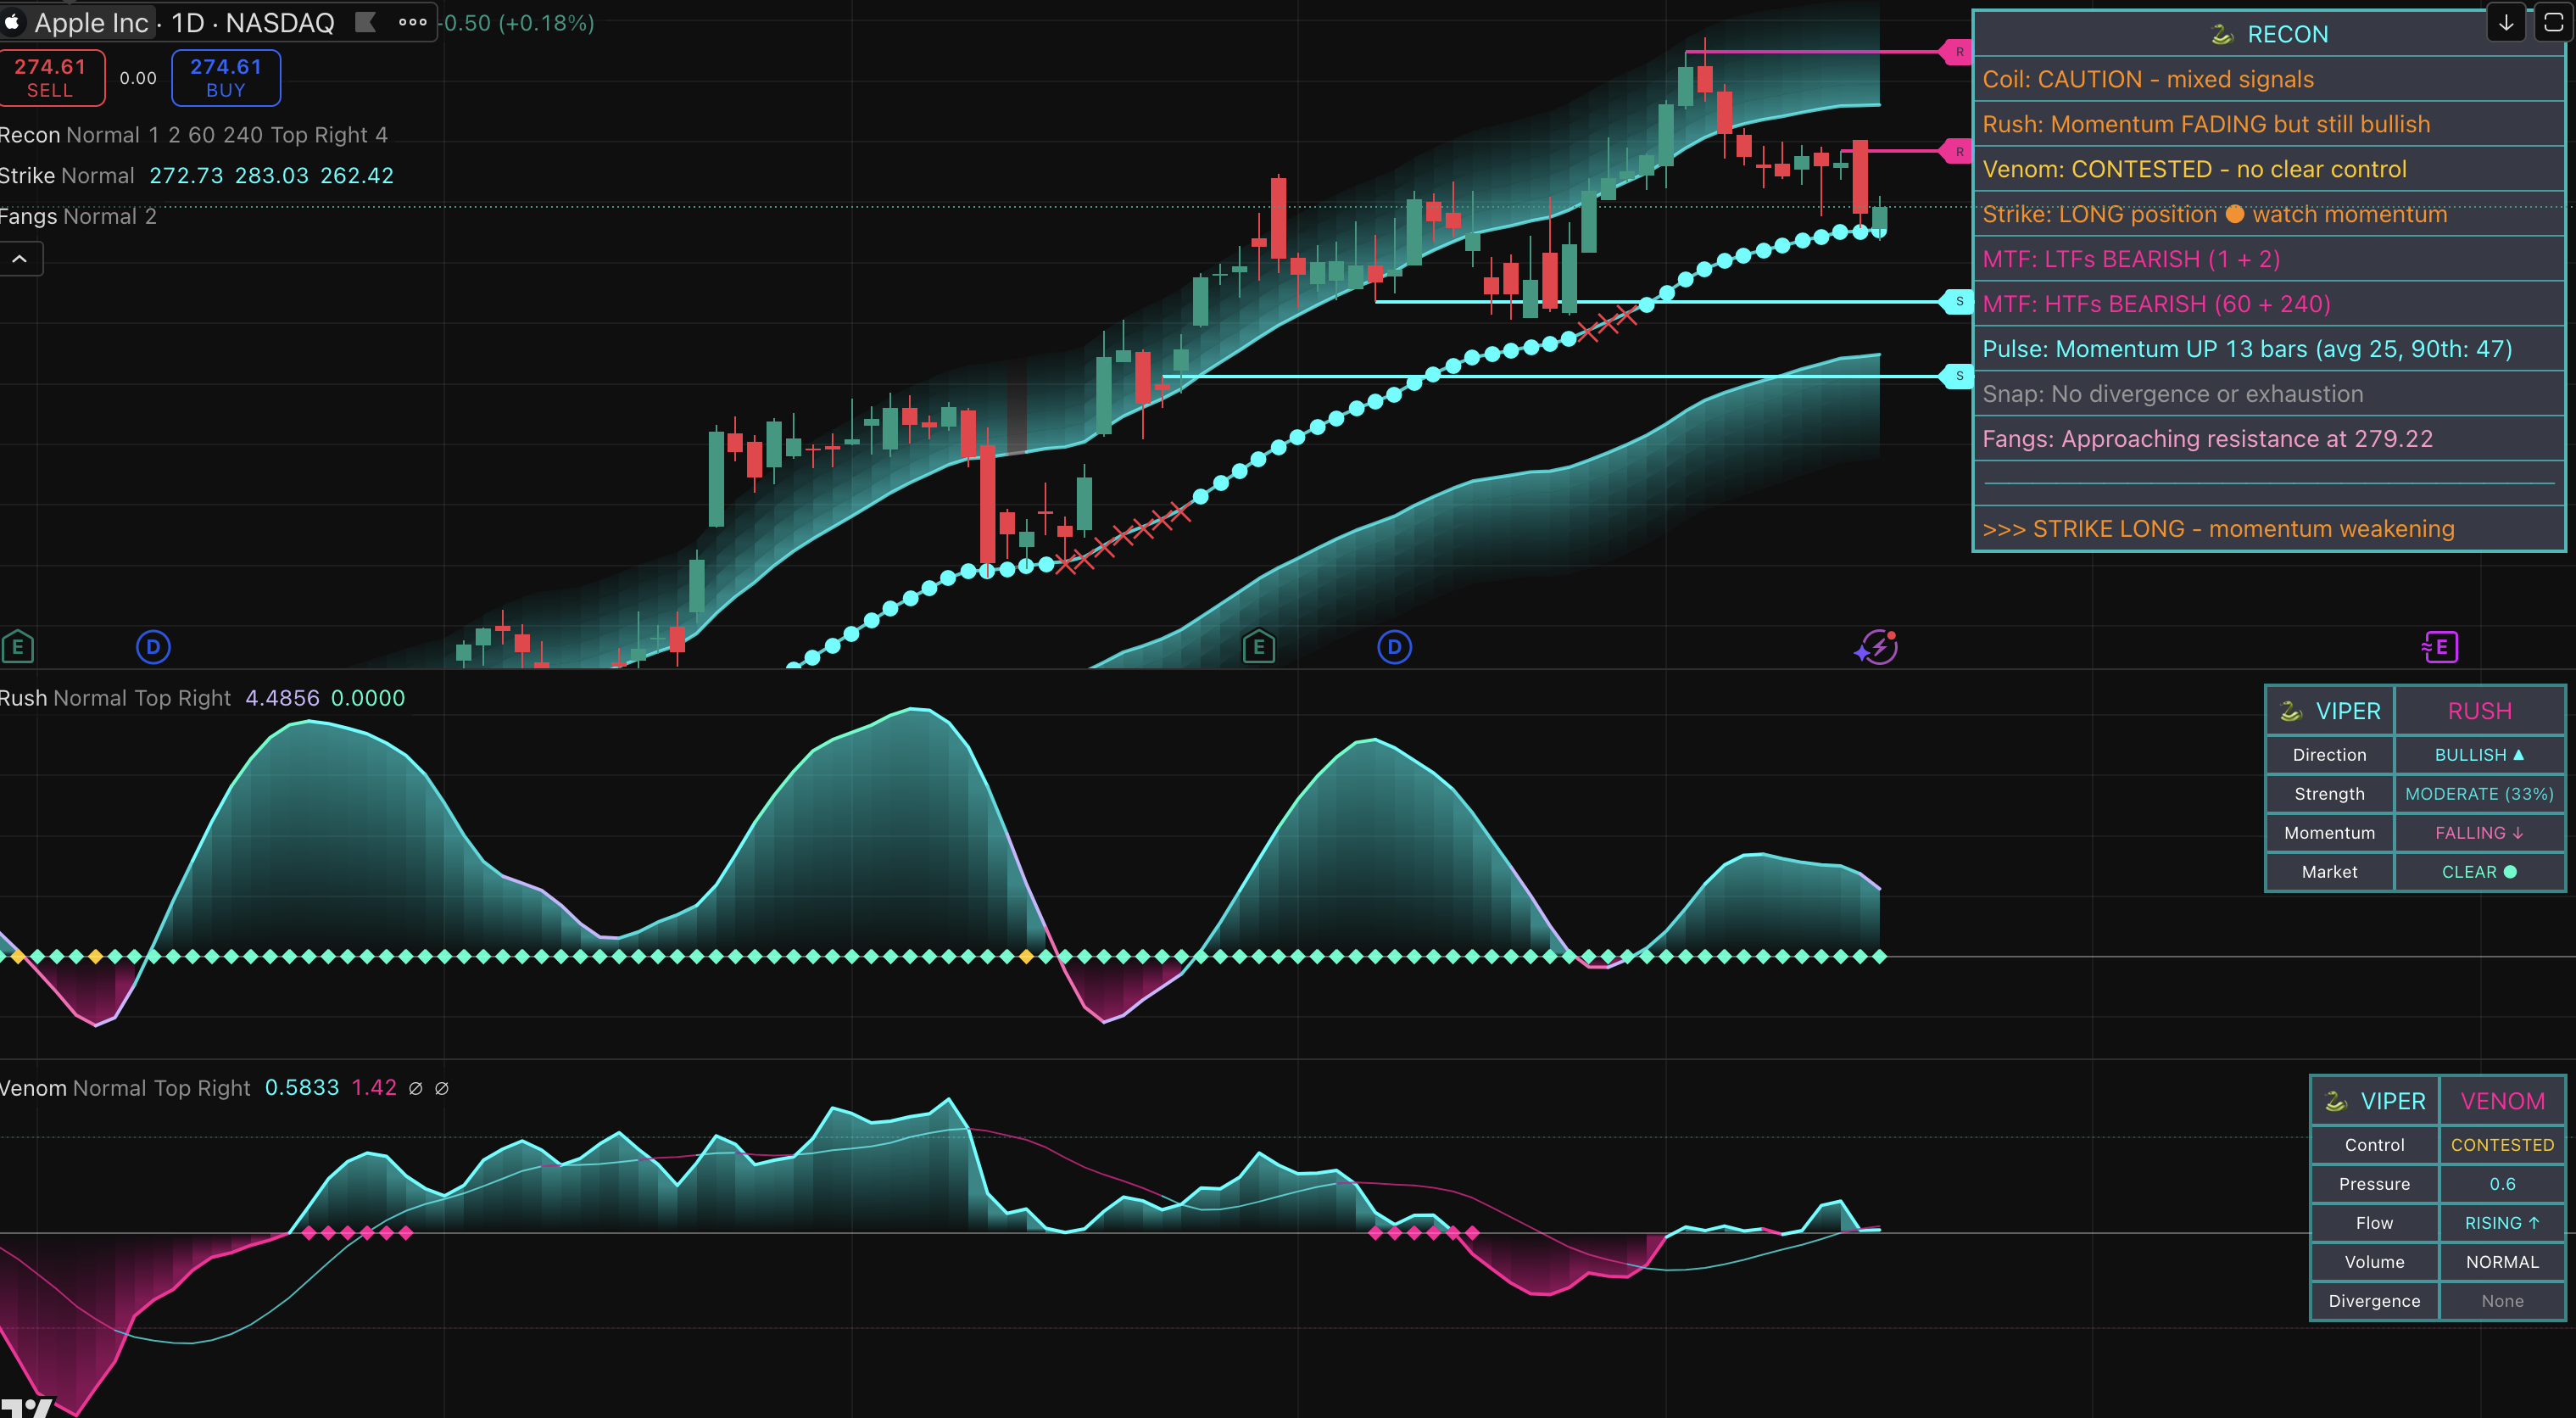


Recon
Your chart, in plain English.
Recon reads the other seven indicators and writes down what they say, in one panel. Each line is one indicator's reading. The last line is the combined call.
- 8 into 1
- every indicator's state, in a single panel
- Plain English
- sentences, not numbers to decode
- Bar close
- the panel updates on closed bars, so it never flickers
- New category
- the cognitive load reducer
- Coil: CLEAR - trend conditions good
- Rush: Momentum RISING above zero
- Venom: BUYERS in control (34.2)
- Strike: LONG position - confirmed
- Pulse: Momentum UP 6 bars (avg 22, 90th: 45)
- Snap: No divergence or exhaustion
- Fangs: Support 4268.8 | Resist none
- >>> STRIKE LONG - trend strong, continuation potential

Strike
The cloud turns. You know.
A trend cloud with entry arrows and momentum confirmation dots. A red cross means momentum has stopped agreeing with your position.
- 3 states
- cyan is up, magenta is down, gray is stand aside
- Bar close
- signals confirm on the close and do not repaint
- 8 alerts
- entries, exits, confirmations, stop and target
- SL and TP
- the midline and the far band, drawn for you
Rush and Venom
How hard it's moving. Who's pushing.

Rush
Momentum as a heat gradient, with dots on the zero line that call out chop.
- 7 steps
- of heat color, from deep magenta to electric cyan
- 3 states
- clear, caution and chop, marked on the zero line

Venom
Buying against selling pressure, measured from volume, with divergence flagged.
- -100 to +100
- who is in control, and by how much
- Divergence
- between price and pressure, flagged automatically
Four more that fill in the picture.
Odds, levels, reversals and chop. Each feeds a line into Recon.

Who built this
I don't just write indicators. I build the platforms they run on.
I wrote WealthCharts, a full charting and trading platform, from the chart engine up. I was one of the first employees at MicroQuant (now Base Camp Trading), and wrote ValueCharts as well as a proprietary in-house trading engine. I've also built indicators and tools on nearly every platform traders use.
SignalViper is what I wanted on my own charts after years of seeing, from the inside, what helps traders and what only adds noise.
Platforms I've built on
- Bloomberg
- TradingView
- NinjaTrader 7 and 8
- TradeStation
- MetaTrader 4 and 5
- Sierra Chart
- eSignal
- MultiCharts
- thinkorswim
All eight indicators. From $29.
Every plan is full access. Pick how often you pay.
Full access.
Cancel anytime.
- All eight indicators
- Recon, the plain-English read
- Pulse streak odds
- Strike, Rush, Venom, Fangs, Snap and Coil
- Cancel anytime
Saves about $72 a year
Full access for 3 months
- All eight indicators
- Recon, the plain-English read
- Pulse streak odds
- Strike, Rush, Venom, Fangs, Snap and Coil
- 3 months of access
Best value. Saves $99 a year
Full access for 12 months
- All eight indicators
- Recon, the plain-English read
- Pulse streak odds
- Strike, Rush, Venom, Fangs, Snap and Coil
- 12 months of access
All sales are final • No refunds • Payments handled by Whop