The suite
Eight tools. One system.
Eight indicators that share the same math and the same presets. Each one answers a single question about the chart.
Recon
What does it all mean?
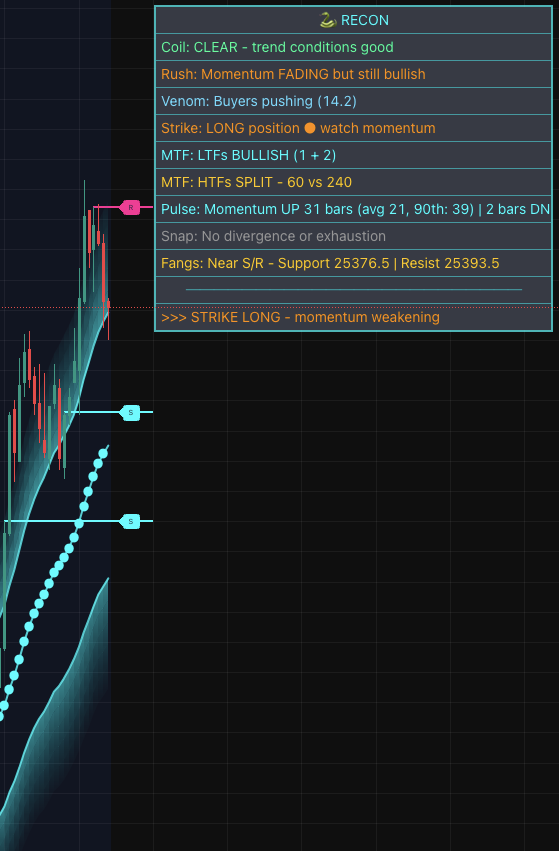
Recon reads the other seven indicators and writes down what they say. One panel, one line per indicator, and a combined call at the bottom. You read sentences instead of decoding numbers and colors.
- A line each for trend, momentum, volume pressure, levels and market state
- Says so plainly when the indicators disagree
- Warnings for divergence and termination pressure
- Color-coded lines for a quick scan
- Updates on closed bars, so the text never flickers
Pulse
How long do runs last?
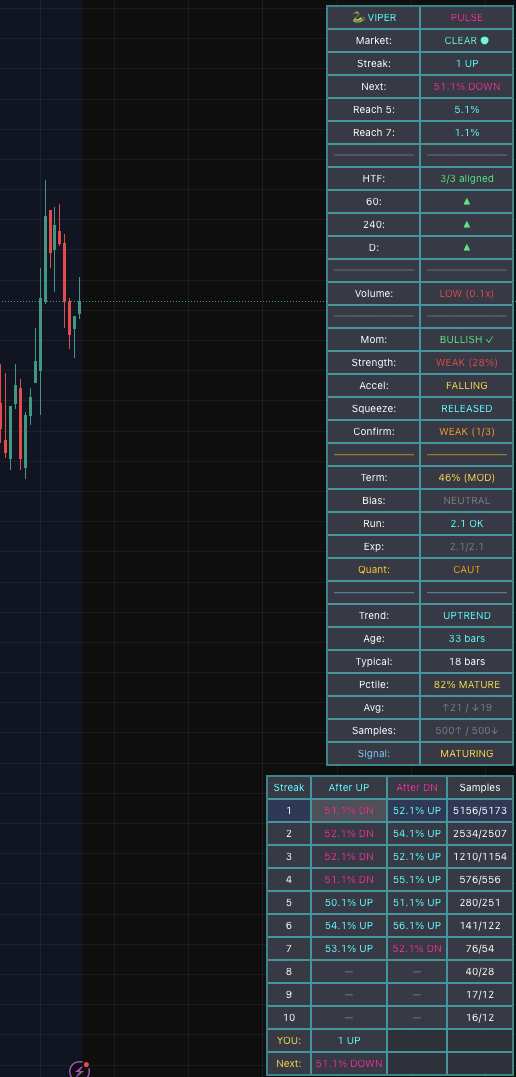
Pulse counts how runs of up and down bars have played out on the symbol you are trading, then gives you the odds for the run you are in. Every number comes from that chart's own history.
- Odds that the current streak continues on the next bar
- Agreement across three higher timeframes: 1H, 4H and daily by default
- Trend age as a percentile of past trends
- Termination pressure, one reading for a move that is running out
- Market bias from how up and down runs have continued
Strike
Which way, and when?
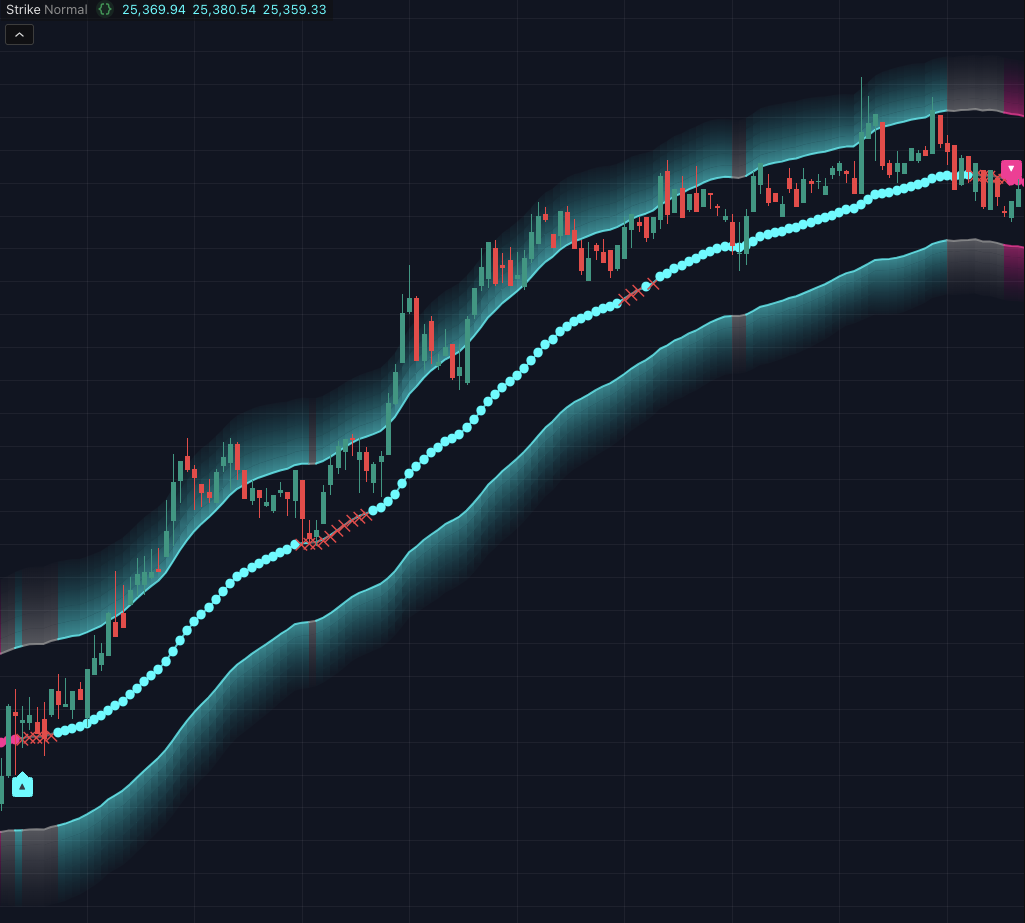
The trend overlay. A cloud around price turns cyan in an uptrend, magenta in a downtrend and gray when there is nothing to lean on. An arrow marks the bar where the cloud flips.
- Trend cloud in three states: cyan, magenta and gray
- Entry arrows when the cloud changes color, confirmed on the bar close
- Dots on the midline while momentum agrees with your position
- A red cross when momentum stops agreeing
- Stop and target reference levels at the midline and the far band
Rush
How hard is it moving?
The momentum pane. Rush draws momentum as a heat gradient in seven steps, from deep magenta to electric cyan, and marks the zero line with dots that tell you whether the market is trending or chopping.
- Seven-step heat gradient for direction and strength
- Zero-line dots: gold for chop, cyan for clear
- Optional caution zones between the two
- Info panel with direction, strength as a percentage, and state
- Alerts for momentum crosses and state changes

Venom
Who is pushing?
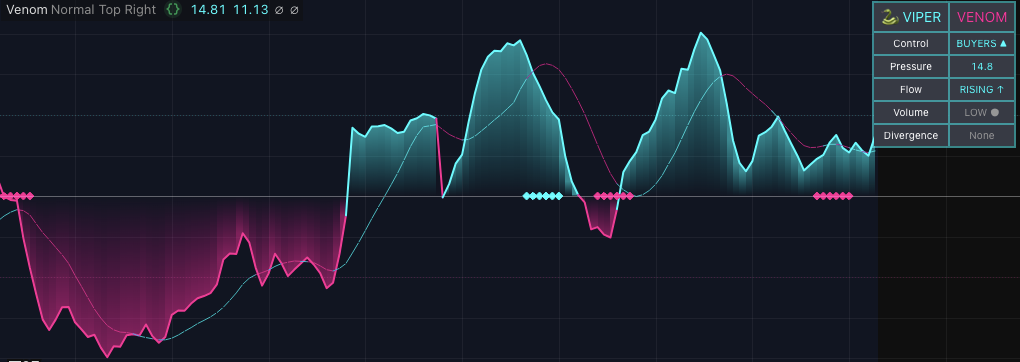
Venom measures volume pressure and plots it from -100 to +100. Above zero, buyers are in control. Below zero, sellers are. It flags a divergence when price and pressure stop agreeing.
- Pressure oscillator: cyan for buying, magenta for selling
- Control state: buyers, sellers or contested
- Divergence markers between price and pressure
- Signal line for confirmation
- Info table with the current flow direction
Fangs
Where are the levels?
Fangs finds support and resistance from price structure and draws the levels for you: cyan below price for support, magenta above for resistance.
- Levels detected automatically from price structure
- Old and broken levels are removed, so the chart stays clean
- Sensitivity presets set how many levels show and how far apart
- Recon reads the nearest levels for its support and resistance line

Snap
Is it stretched?
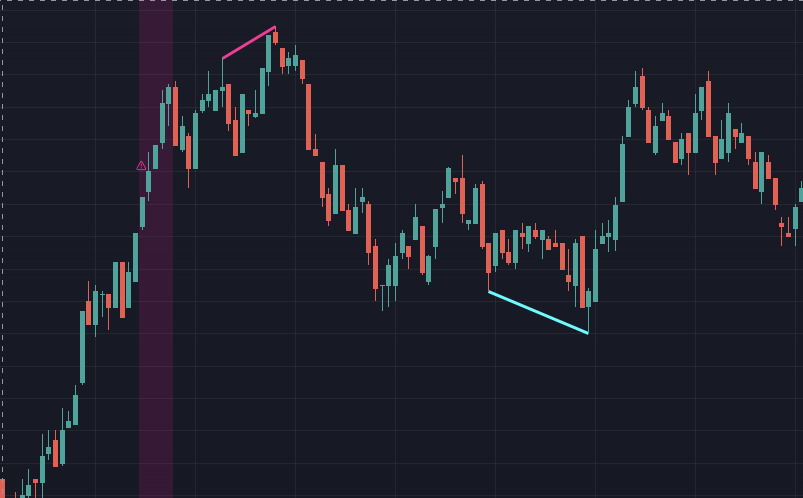
Snap compares price with momentum and marks the spots where they split. A new high on weaker momentum is a warning that the move is tiring.
- Bullish and bearish divergence, drawn as lines on the chart
- Danger zones shaded when price is stretched and momentum is extreme
- Warning labels at each divergence
- Low, Normal and High sensitivity
Coil
Is it even trending?
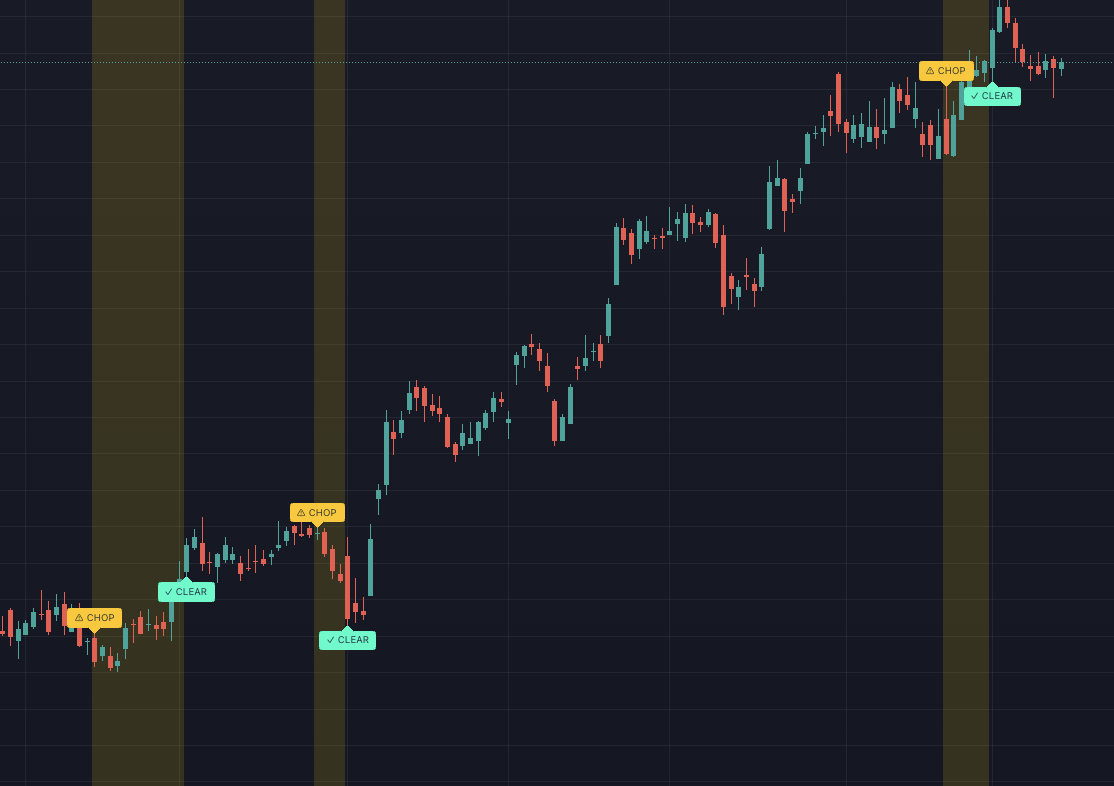
Coil sorts the market into three states: chop, caution and clear. It shades the chart when conditions are poor, so you can see at a glance when to wait.
- Three states: chop, caution and clear
- Background shading: gold for chop, orange for caution
- Labels where each state begins and ends
- A filter for Strike and Rush signals
Across the suite
What all eight share
Alerts
Every signal has a TradingView alert condition. TradingView delivers it the way you have alerts set up.
Any market
Stocks, crypto, forex, futures and commodities. If TradingView charts it, the suite runs on it.
Any timeframe
Intraday to monthly. The presets do not change with the chart.
Bar-close signals
Signals confirm when the bar closes and stay where they printed.
Three presets
Low, Normal and High sensitivity. One choice instead of a page of settings.
One color language
Cyan is bullish, magenta is bearish, gold is chop. It means the same thing on all eight.
Get started
All eight, from $29.
Every plan is full access. Pick how often you pay.